
Netflix Engineers Never Ask "What Depends on This?" Anymore
How Netflix Killed the Worst Part of Being On-Call

TLDR
Netflix runs on thousands of microservices. When one breaks at 3am, the on-call engineer needs to know what depends on it, what it depends on, and whether the problem is local or upstream. That answer used to live in the engineer’s head. Now it lives in a real-time topology graph that pulls from three independent data sources, merges them into a unified dependency map, and answers traversal queries in under a second. This is how they built it, and why it’s harder than it looks.
Your Observability Stack Has a Blind Spot
You have metrics. You have logs. You have traces.
What you don’t have is the map.
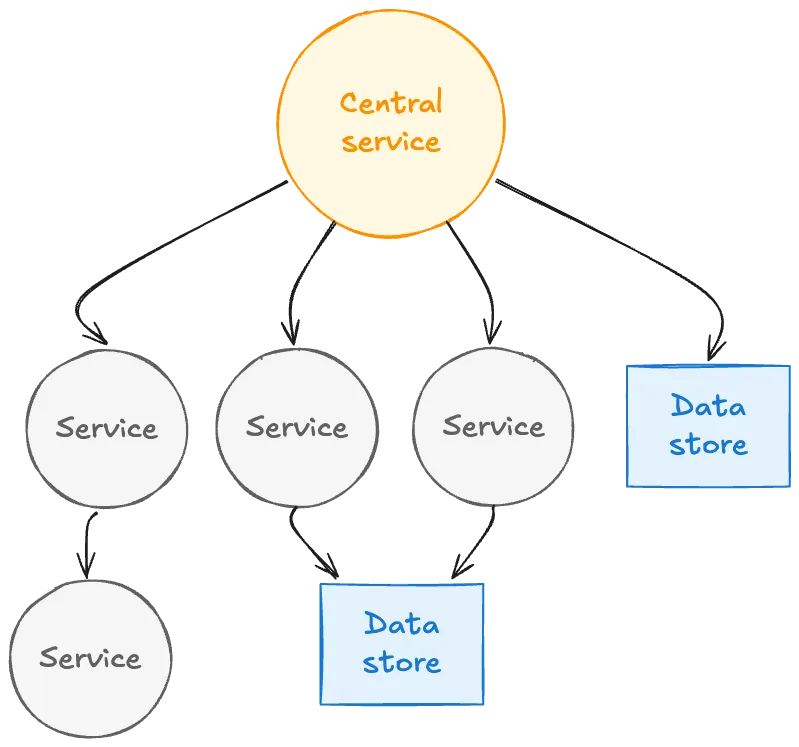
Metrics tell you something is wrong. Logs tell you what one service did about it. Traces follow a single request through the system. None of them tell you how everything connects. Not the live, accurate, right-now picture of which service calls which other service under actual traffic.
At Netflix, that missing map was a 3am tax. Engineer gets paged. Service is degraded. They open dashboards, pull up traces, check recent deployments, and spend the first 20 minutes reconstructing a dependency picture that should already exist. Meanwhile members can’t watch their shows. The clock is running.
The gap isn’t the tools. Metrics, logs, and traces are all genuinely useful. We’ve covered how to make them work together in the observability guide. The gap is the layer those tools don’t share: a unified, live view of how the system is actually wired.
Netflix decided to build it.
Why One Source Isn’t Enough
The naive solution is: scrape your service mesh or pull from your tracing infrastructure and call it a day.
Netflix tried. It doesn’t work.
Every data source gives you part of the picture. Every data source has a blind spot. The only way to get something accurate is to combine them and let each one cover what the others miss.
They pull from three.
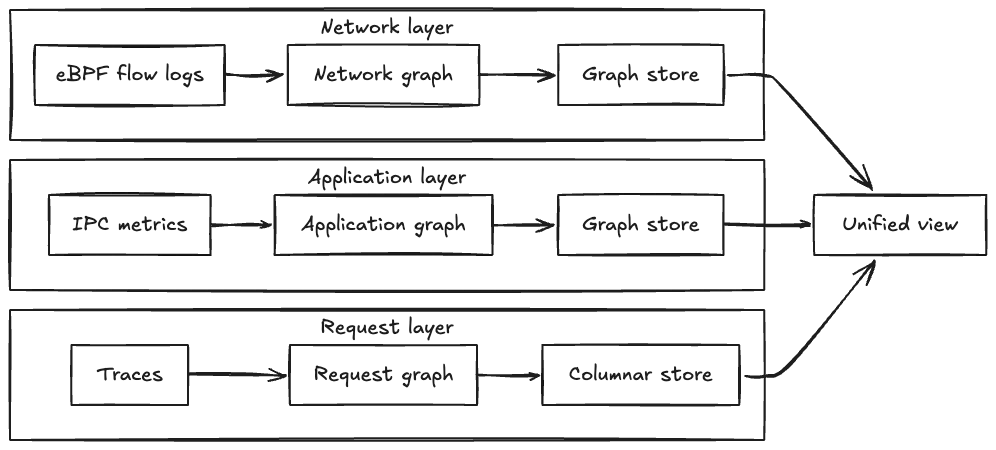
eBPF network flow logs. Captured at the kernel level. Complete coverage — if two services are talking, you’ll see it, instrumented or not. The problem: you get IP-level connectivity with no application context. You can see that Service A is calling Service B. You can’t see which API endpoint, what protocol, or what the call pattern looks like.
IPC metrics. Emitted by instrumented services and carry everything eBPF misses: endpoint detail, protocol, call rates. The problem: only instrumented services emit them. Any service that doesn’t participate is invisible to this layer entirely.
Distributed traces. This is where conditional logic shows up. Not “Service A can call Service B” but “Service A did call Service B to serve this specific request.” Traffic that only triggers for 2% of users will appear in traces even if it’s nowhere else. Netflix aggregates these into topology at both cluster-level and app-level depending on what granularity the investigation needs.
Each source lives in a separate graph partition. Query any one independently, or query all three in parallel and get back the merged union. Nodes and edges from every layer, each preserving its own properties.
Salesforce ran into the same multi-signal problem with their observability platform. Different signal types cover different failure modes. Picking one means accepting blind spots. The answer is always the same: instrument multiple layers and merge.
The Pipeline
Getting three live data sources into a consistent, queryable graph in near-real-time is where things get interesting.
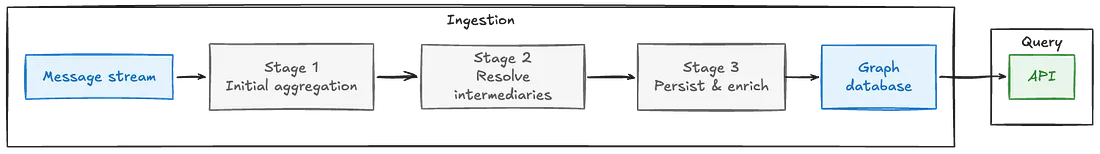
The processing pipeline runs on Apache Pekko Streams across multi-region Kafka consumers. Flow logs move from Kafka through three aggregation stages: initial batching, intermediary resolution, and final enrichment. Batching reduces write amplification. Resolution maps IP addresses to service identities (the eBPF layer gives you IPs, not service names, so this translation step matters a lot). Enrichment adds the metadata that makes the graph actually navigable rather than just technically accurate.
Graph storage sits on Netflix’s internal distributed key-value system with a graph database layer designed for fast traversal. The read API is gRPC, with multi-hop traversal support, filtering by availability tier and business domain, pagination for large result sets, and sub-second response times as a hard SLA. Not a target. A hard requirement.
The history model is worth understanding. Historical queries use time-window aggregation rather than storing separate snapshots. Snapshots would be expensive. The graph changes every time a service deploys, and Netflix deploys constantly. Time-window aggregation gives engineers what they actually need without the storage cost: what did this topology look like 15 minutes before the incident started? That question is exactly what made the AWS October outage so hard to debug in real time. You need the before-picture, not just the current state.
One thing they learned from earlier failed attempts: static or delayed maps are useless. In an environment where services deploy multiple times per day, any map that isn’t continuously updated is already wrong. Documentation gets stale. Configuration databases drift. The only topology data that stays accurate is topology data derived from live traffic.
What Engineers Actually Get
Three capabilities changed daily work at Netflix.
Dependency visualization on demand. Any engineer can pull upstream and downstream dependencies for any service, filter by availability tier or business domain, and choose between the unified view or individual graph layers. No more Slack messages asking “does anyone know what calls the payments service?” No more archaeology through three-year-old architecture diagrams.
Blast radius estimation before deploys. Before touching a service, you can see exactly what depends on it. This is the design-time use case that rarely gets enough credit. Slack’s anomaly response system uses dependency awareness the same way: to tell the difference between a service that’s genuinely broken and one that’s just noisy because its upstream failed. You can’t make that call without the map.
Direct jump-through to signals. From any node in the topology, you navigate straight to logs, traces, and metrics for that service in the right time window. No hunting for service names. No guessing at which dashboard to open. The topology provides the context, the existing tools provide the depth.
Netflix’s roadmap extends this further. They’re adding deployment and configuration change events to the graph, so you can see not just what’s calling what but what changed when. Long term: automated root cause analysis on top of the graph. That’s the real payoff of building this right. You don’t just use it to investigate incidents. You use it to stop having them.
What to Take Back to Your System
Your dependency graph is wrong. If it lives in a wiki, a diagram, or anyone’s memory, it’s already stale. The accuracy degrades every time a service deploys. At high deployment velocity, manually maintained topology isn’t a documentation problem waiting to get fixed. It’s an incident waiting to happen.
No single signal gives you the full picture. eBPF gives you coverage but no context. IPC metrics give you context but only for instrumented services. Traces give you behavioral accuracy but only for sampled paths. The right answer is all three. If you’re picking one to start with, pick tracing. It’s the most immediately actionable and the easiest to correlate with specific incidents.
Build for the 3am question. “What does this service depend on, right now?” That’s the question. Your topology system should answer it in under a second. Every second of manual reconstructing dependencies during an incident is a second of avoidable pain.
Time-window aggregation beats snapshots. If you’re building historical topology for incident correlation, don’t snapshot the full graph at intervals. Too expensive at high change velocity. Aggregate by time window and reconstruct on demand. You get what engineers actually need without blowing up storage.
Blast radius is a design-time question, not just an incident question. The real leverage of dependency mapping isn’t post-incident. It’s pre-deploy. “If I touch this service, what breaks?” That question, answered cheaply and accurately before a deploy, is worth more than any amount of faster incident response after one.